Insights is the screen most people land on right after signing in. It answers two questions at a glance — how is each part of the business doing? and what is waiting on someone today? — and it doubles as the map to everything else. This tour shows you how to read it and how to move around from there.
Step 1 — Read the scoreboard
Click Insights in the sidebar. The page opens on a scoreboard: one card per module your business runs — Sales, Front desk, Stock, Cash, People, and so on — each with its headline figures for the selected period. Beside each figure sits its movement against the previous period of the same length: a range of thirty days is compared with the thirty days before it.
Colour tells you whether the move is good for the business, not which way the number went. Refunds falling shows green; no-shows rising shows red. A figure with no movement beside it either had nothing to compare against or is a point-in-time balance, like the cash position, that a period cannot move.
Pick the date range at the top right to re-focus the scoreboard and the widgets below it at once; the comparison period follows automatically. Each card ends in a link to that module's reports, opened on the same range.
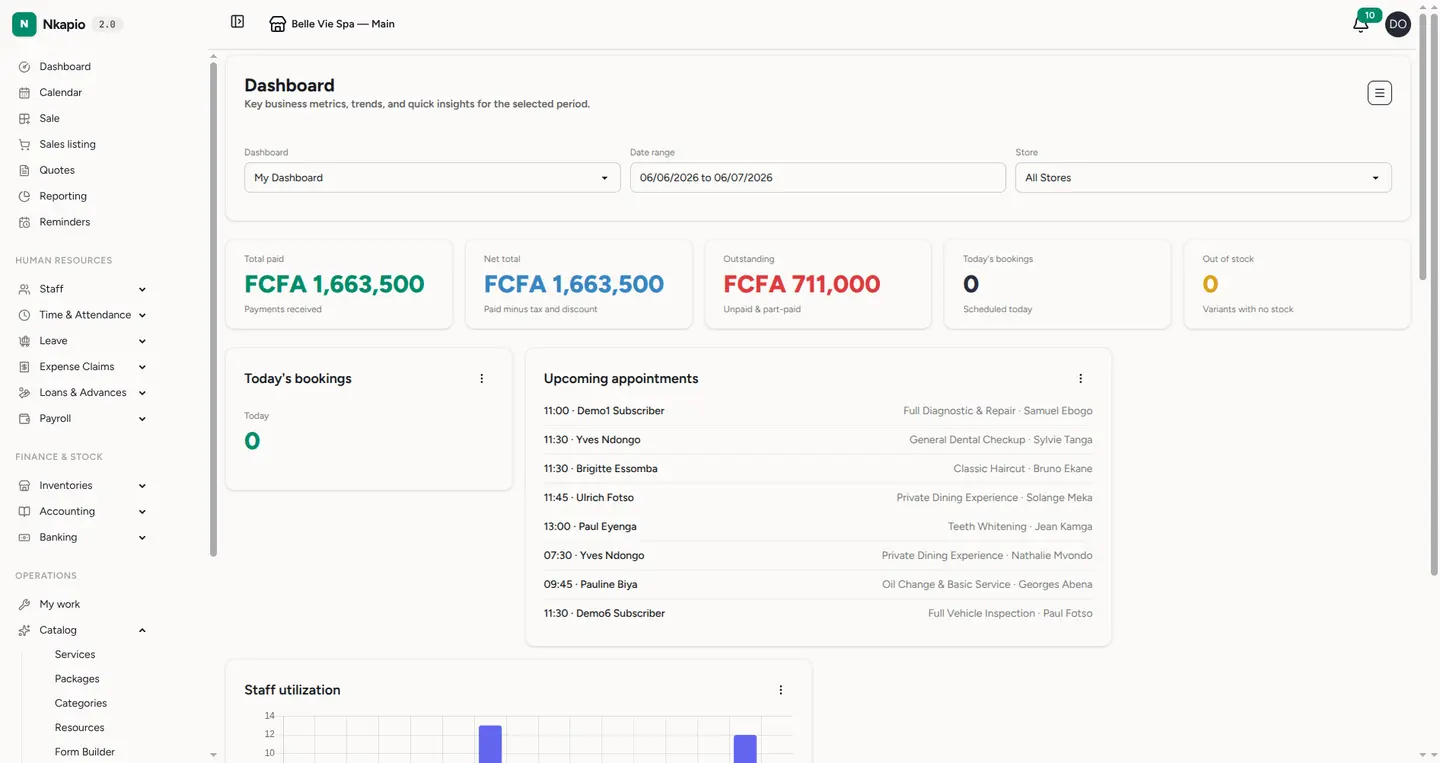
Which cards you see depends on the modules your business uses and on what your role lets you read. If a card is missing, that module simply isn't active for you or isn't yours to see — nothing is broken.
Step 2 — See what needs your attention
Under the scoreboard, Needs your attention lists what is waiting on someone right now: invoices overdue, quotes about to expire, jobs waiting on a deposit, estimates unsigned after a day, finished jobs not yet invoiced or not collected, leave requests to approve, and more. Each line ends in the action to take and opens the screen where you take it.
This list is always now — the date range does not change it. When nothing is waiting, the page says so and names what it checked, so a quiet morning never looks like a broken page.
Step 3 — Your widgets
Below the attention list is a grid of widgets — small cards showing a trend, a chart, a short list or a table (sales trend, top products, staff utilisation, upcoming appointments, and so on). Nkapio gives every business a starter set chosen to match its line of work, so a salon, a shop and a clinic each open to a sensible default rather than a blank page.
The widgets are yours to shape. Use the Store filter above them to focus on one location, and the menu button in the top-right corner for Quick actions: add a widget, edit the current board, or create an additional one. Widgets come in three sizes (small, medium, large) and can be dragged into the order you prefer. You can also keep several boards and share a board with specific team members.
Two things decide whether a given widget appears: the module must be switched on for your business, and you must have permission to see that kind of data. That is why a colleague might see a widget you don't — it reflects each person's role, not a fault.
Step 4 — The sidebar is the map
The day-to-day screens sit on top — Insights, Front desk (today's jobs and appointments), the Calendar, Sale and Quotes — followed by the module groups: Human Resources, Finance & Stock, Operations and System. Groups expand on click, and you'll only see the sections your plan and permissions include.
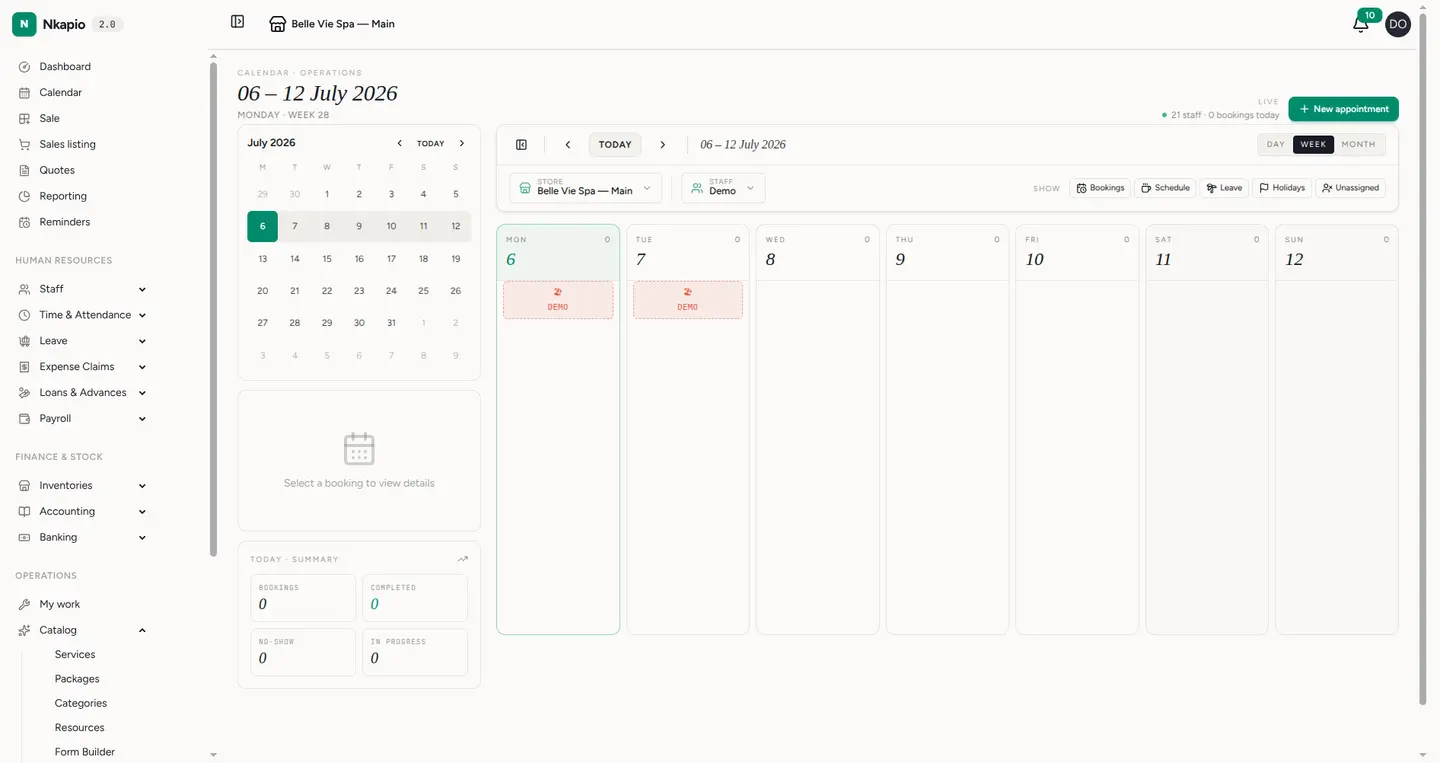
The two screens you'll open most are the Calendar, which shows every staff member's day side by side, and Sale, the point of sale where services, products, packages and gift cards are charged.
Tip: the bell icon in the top bar collects your notifications; the store button beside the logo switches between your locations.
Common questions
- A card or a widget is missing. Either the module isn't active for your business or your role doesn't grant access to that data. Ask an administrator if you think you should see it.
- A card says "Could not load". One of its figures could not be computed just now. Reload the page; if it persists, the module's own reports page will show the error in full.
- I don't have an Insights link at all. Insights is available to team members with reporting or booking access; without it, Nkapio simply opens on another screen you can use.
- A widget says there's no data. There's nothing to show for the selected period and store — widen the date range or switch the store filter.